Category Archives: project

Neuronale Netze zur Prognose von Online-Reichweite

Mit Hilfe von Deep Learning und neuronalen Netzen hat Folge 3 ein Prognose-System realisiert, mit dem sich die Reichweite von Anzeigenschaltungen vorhersagen und steuern lässt.

Das System ist für unterschiedliche Arten von bezahlten Anzeigen nutzbar – beispielsweise für Stellenanzeigen, Werbeanzeigen oder für Premiumprofile. Sowohl für laufende als auch für zukünftige Schaltungen kann die wahrscheinliche Reichweite über die Laufzeit vorhergesagt werden.

Unterstützung im Geschäftsprozess

Das Prognose-System unterstützt den den Geschäftsablauf beim Kunden an mehreren Stellen:

Vertrieb: Der Verkäufer kann prognostizieren, welche Reichweite sich mit welchen buchbaren Optionen erzielen lässt. Er kann live verschiedene Optionen durchspielen und seinem Kunden demonstrieren, wie das Zubuchen von Sonderleistungen die Reichweite erhöhen kann. Gemeinsam mit dem Kunden kann er entscheiden, welche Optionen für den Kunden das optimale Ergebnis bieten.

Monitoring: Mit Hilfe der Prognose können die Sachbearbeiter während der Laufzeit erkennen, ob eine Anzeige Gefahr läuft, weniger Reichweite zu erreichen als vorhergesagt.
Für Anzeigen, für die das zutrifft, kann das System Alarm schlagen und Möglichkeiten zur Performance-Steigerung vorschlagen.

Steuerung: Wenn eine Anzeige weniger Reichweite erzielt als vorhergesehen, können Reichweiten-steigernde Maßnahmen aktiviert werden. Dabei kann die Vorhersage genutzt werden, um zu entscheiden, welche Maßnahme ausreichend viel zusätzliche Reichweite einbringt, so dass die zugesagte Performance am Ende der Laufzeit erzielt wird.

Training und Optimierung

Zum Training des Neuronalen Netzes werden Reichweite-Daten aus den letzen Jahren herangezogen. Um so mehr Daten zum Training zur Verfügung stehen, umso exakter werden die Vorhersagen sein, die das System erzeugt. Es reichen aber „handelsübliche“ Datenmengen“ wie sie heutzutage in mittleren Webangeboten erreicht werden. Das System benötigt kein „Big Data“ um verläßliche Prognosen zu erstellen.

Deep Learning bezeichnet einen Satz von Methoden, die gemeinsam haben, dass sie ein neuronales Netz mit realen Daten in vielen aufeinanderfolgenden Iterationen trainieren. Nach jeder Iteration wird die Qualität der Prognose gemessen und die Einstellungen werden für die nächste Runde angepasst. In dieser evolutionären Vorgehensweise werden Einstellungen, die schlechtere Ergebnisse erzielen, schnell als Sackgassen erkannt und das Modell kann schrittweise die Vorhersage-Qualität steigern.

Das Trainieren des Netzes beginnt man in der Regel mit Eigenschaften, die einen klaren Einfluss auf die prognostizierte Größe haben. Sobald die Prognosen ausreichend gut sind, können schrittweise weitere Einflüsse in das Training aufgenommen werden. So lassen sich auch zum Beispiel saisonale und / oder regionale Einflüsse kontrolliert mit in das Modell einbeziehen.

Vielfältige Anwendungsfälle

Prognosen mit neuronalen Netzen sind nicht auf den Anwendungsfall „Reichweite von Bezahlanzeigen“ beschränkt, sondern können vielfältig genutzt werden. Beispielsweise prognostiziert Folge 3 in einem anderen Projekt für einen Großhändler die Dauer, die für das Verpacken einer Bestellung benötigt wird. Diese Prognose hilft dabei, die Auslastung der Packtische zu optimieren.

Folge 3 unterstützt bei der Ideenfindung und der Bewertung der vorliegenden Daten, zum Beispiel im Rahmen eines Data Discovery Workshops. Wir übernehmen das Training des Systems und deployen es auf unseren oder auf Ihren Servern. Anschliessen können die Ergebnisse von Mensch und Maschine genutzt werden. Im Browser können Sie mit Hilfe von generischen oder eigens für Ihren Anwendungsfall erstellten Dashboards und Tools auf die Prognose zugreifen. Gleichzeitig können Sie die Vorhersagen auch über eine REST-API abrufen, um sie in maschinellen Abläufen einzusetzen.

Für genauere Auskünfte melden Sie sich gerne unter data@folge3.de

Ranking digital agencies

Das Fachmagazin kress pro befragt jährlich die 150 reichweitenstärksten Online-Sites Deutschlands mit welchen Tech-Dienstleistern sie zusammenarbeiten und erstellt daraus ein Ranking. Wieder einmal zeigt sich, dass selbst große und autarke Publisher auf die Zusammenarbeit mit Spezialisten angewiesen sind um ihre Geschäftsmodelle ausschöpfen zu können. Besonders interessant: Große Agenturen spielen in dem Ranking keine wichtige Rolle. Die Kleinen machen das Rennen und bieten neben schlankem Projektmanagement genau die Expertise, die sich ganz nach den Anforderungen der Kunden ausrichtet.

Folge 3 ist die Nr. 1 der Spezialagenturen im Ranking der wichtigsten Digitalagenturen für Medienunternehmen 2019. kress pro veröffentlicht das gesamte Ranking in seiner Ausgabe 05/2019.

Assistance system

We give a warm welcome to Jungheinrich as our most recent client. Within the next year we will develop two innovative projects in close cooperation.

About Jungheinrich:
Established in Hamburg, Germany, in 1953, Jungheinrich looks back on an extraordinarily successful company history. With over 15,000 employees worldwide and operations in more than 36 countries, Jungheinrich is an internationally leading provider in the field of intralogistics solutions.

Museum display

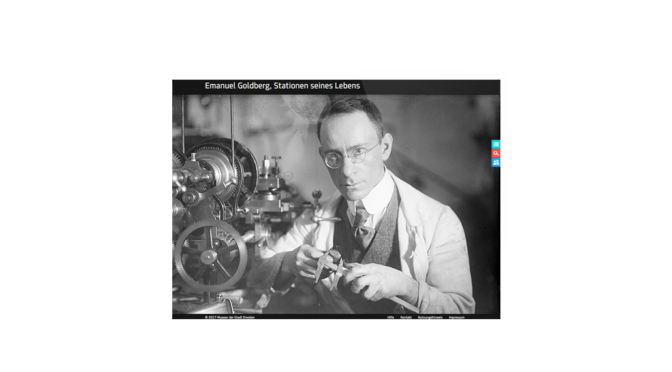
For the museums in the city of Dresden we have created a collection database which acts as a virtual museum. In a temporary exhibition focusing on the Jewish inventor Emanuel Goldberg, who, amongst other achievements, was a co-founder of Zeiss Ikon, an adaptation of this application is being used as a kiosk system in the exhibition area. Here, visitors can access information about the exhibits during their visit. As a result, the collection database can be used for temporary events.

The web database’s interfaces can be set up cost effectively as a kiosk system for an exhibition project with relatively little effort. Based on the user interface’s modular structure, single functions in the collection database can be put together for temporary events as required. The data pertaining to the relevant works will then be linked with this adaptation.

… more about the project: Virtual museum

Virtual museum

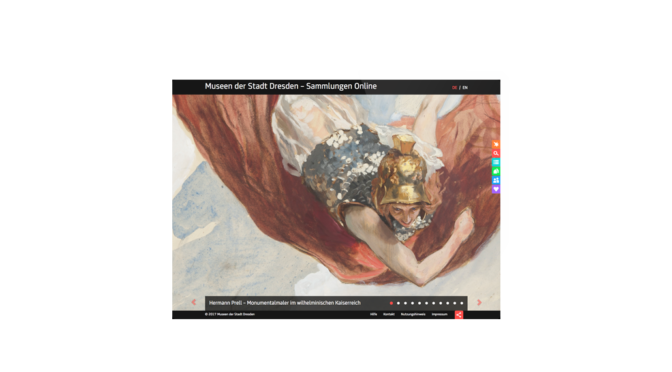
Dresden’s museums are part of an association of eight municipal museums in the regional capital of Saxony and look after the city’s art collection, objects pertaining to the city’s history and Saxony’s industrial and technological history. They represent the memory of civic Dresden and the region and document its varied history as silent witnesses. The collections comprise artworks and objects of all kinds. Paintings, graphics, sculptures and industrial objects, written documents and handicrafts.

For some time, these artefacts have been digitalized to present them on the internet to a wider audience. In the “virtual museum” thus created, users can become acquainted with the collections irrespective of where they are located, and follow up on what they have seen during a museum visit, thus deepening their knowledge. This expansion into the virtual world offers museums many attractive options. They can expand their reach, involve the interested public more and continue to build on their social significance. The creation of the collection database was put out to tender as part of an ideas competition by the museums of the city of Dresden. Our concept prevailed against three other competitors, winning the contract to implement the project.

The focus of our approach is always based on the current content, be it individual objects, curated object contexts or results of user inputs such as searches or assembling artefacts in collection folders. All the tool’s controls are arranged around the edges and can be folded out when needed. This provides the greatest amount of space possible for the objects to be displayed at full resolution and shown in the greatest detail. Depending on the context, further levels of detail with meta information, alternative views and contexts can be displayed.

It is possible to access the collection both by browsing and by taking a specific route. In addition to curated tours, access to the academic system, and a field-based filter, above all, the integrated live full text search offers immediate and simple access to the many thousands of objects that have lain dormant for years as undiscovered treasures in the archives, and which in future years will be available to public scrutiny.

… more about the project: Museum display

visit Sammlung OnlineMuseen der Stadt Dresden

TCloud

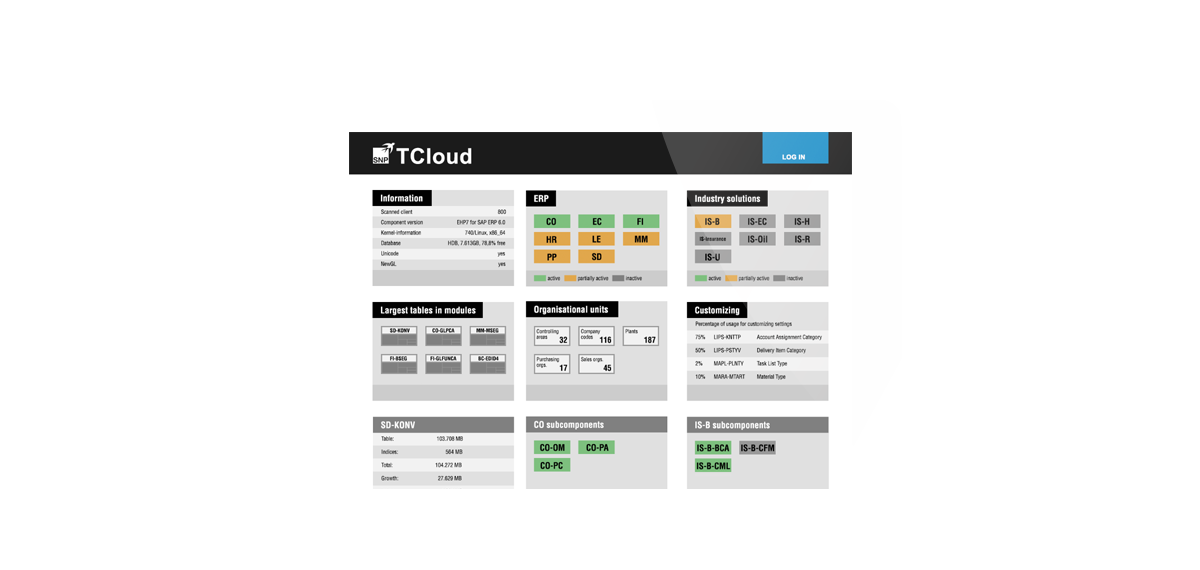
As part of a prototype project for Schneider-Neureuthner Partner AG (SNP), we have explored how complex information can be intuitively represented and used.

On behalf of its customers, SNP is carrying out SAP transformations, during which detailed insights into customer systems are required. In large companies, SAP systems create complex, linked structures which vary in different ways depending on the angle and task in hand. These structures cannot be easily illustrated with simple, tabular representations. Therefore, they do not facilitate intuitive access and do not demonstrate their effectiveness in the transformation process adequately.

We have implemented three measures in the prototype that allow structures to be represented more clearly and used more effectively:

  • Using a modern, information-centred layout supports detecting relevant information quicker.
  • Use-case oriented aggregations reduce the wealth of information and only present the details germane to the current task.
  • Interactive tools structure the information separately for the respective context. They offer options for changing perspectives and for focusing on specific aspects of currently relevant structures.

Energy campus

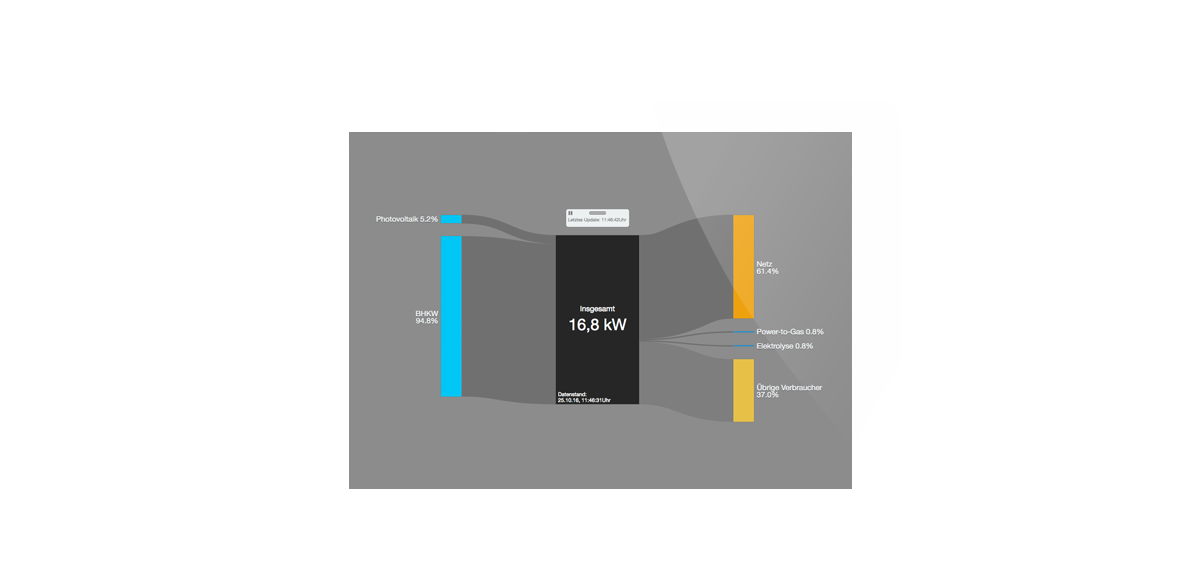
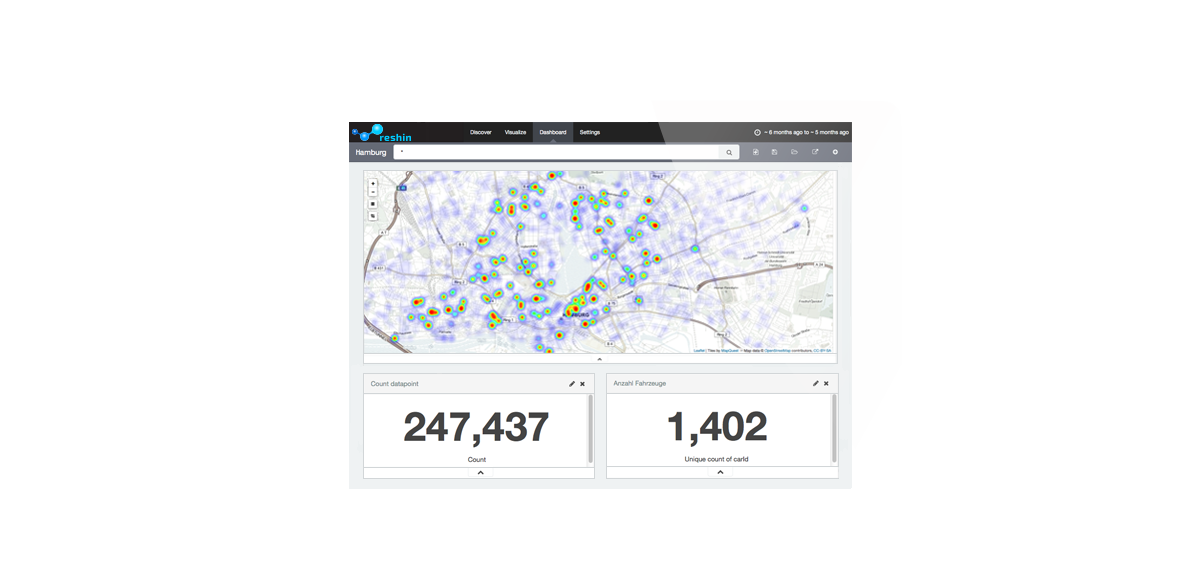
The Competence Centre for Renewable Energies and Energy Efficiency (CC4E) located on the Energy Campus at HAW Hamburg is developing sustainable solutions for society’s energy problems. In a smart grid laboratory at the institution, efficient and intelligent strategies are being developed and tested to analyze the interaction of energy production, consumption and storage. As part of the hackathon “What the Data!?” hosted by Cybus and Dezera, we built a basic system for monitoring energy flows in house.

Electricity is generated on campus using photovoltaics and thermal power stations. If the current consumption is higher than the generation that moment, the difference is covered by the building connection to the electricity grid. On the other hand, electricity can be stored in the public grid as soon as the current generation exceeds actual use. Our live visualisation shows the current relationship between supply and consumption.

The energy campus data is read out using Cybus middleware and provided from a MQTT broker. Reshin subscribes to the relevant topics of the broker, stores them for historical access and uses them for various visualizations.

visit Reshin

U-Multirank mobile

U-Multirank is a new multidimensional, user-driven approach to international ranking of higher education institutions. The dimensions it includes are teaching and learning, research, knowledge transfer, international orientation and regional engagement. Based on empirical data U-Multirank will compare institutions with similar institutional profiles and allow users to develop personalised rankings by selecting indicators in terms of their own preferences.

European Commission is funding the project for the next two years. A first ranking will be published in early 2014 covering at least 500 higher education institutions from Europe and beyond. It will provide an institutional ranking of whole institutions as well as field-based rankings for engineering, business and physics. After 2014 the coverage of institutions and fields will be extended progressively.

Folge 3 is a partner in an international consortium to develop U-Multirank. We were responsible to deliver the brand strategy, the logo and the webtool.

… more about the project: U-Multirank Sunburst

b_facebookb_twitter

– – – – – – – – – – –

Press
ZEIT online
Tagesspiegel
The New York Times
ETH Zürich
Süddeutsche Zeitung
EuroScientist

ELK

The ELK stack (Elastic, Logstash, Kibana) offers real-time analytics and custom dashboarding as an open-source solution. Elastic is used as a flexible big data store by the top Fortune 500 companies. Logstash ensures continuous importing of data, and Kibana allows its flexible visualization.

Being available as open source, solutions can be set up and tried out quickly using the ELK stack. The higher the requirements are, the more complex planning, installation and operation becomes. At that point at the latest, it is worth putting trust in collaborating with specialists.

Folge 3 offers support in using ELK

  • Configuration of Elastic
  • Efficient log parsing with Logstash
  • Building dashboards with Kibana
  • Implementing custom expansions for Elastic, Logstash, Kibana

We have developed expansions for more sophisticated installations using Reshin, the data analytics platform which can be operated securely in companies with the ELK platform, allowing to use ELK not only for monitoring and visualization but data analytics, too.