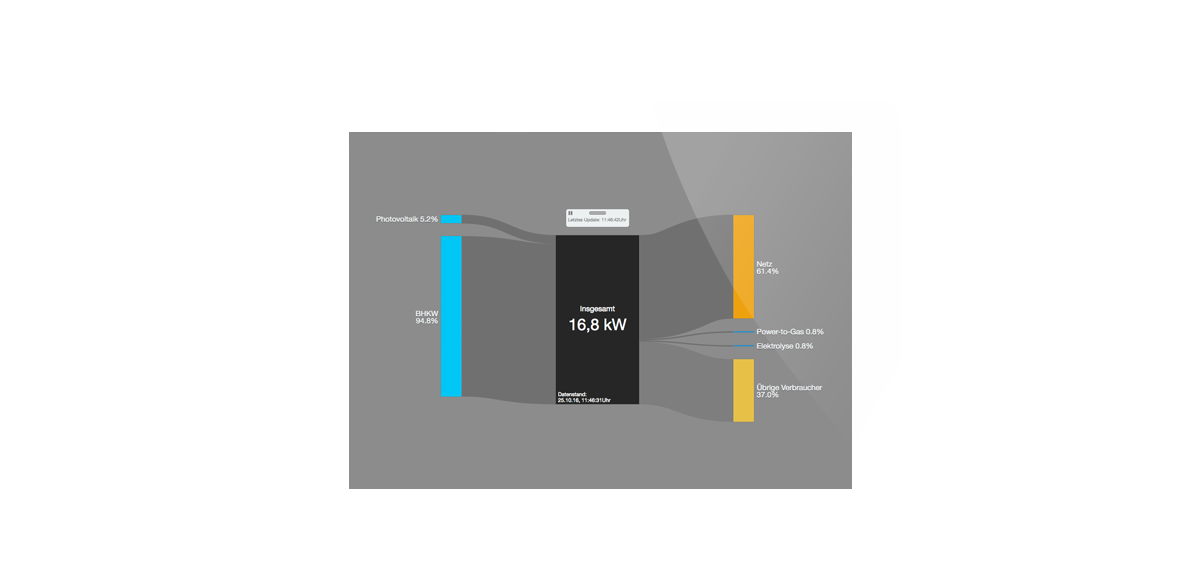
The Competence Centre for Renewable Energies and Energy Efficiency (CC4E) located on the Energy Campus at HAW Hamburg is developing sustainable solutions for society’s energy problems. In a smart grid laboratory at the institution, efficient and intelligent strategies are being developed and tested to analyze the interaction of energy production, consumption and storage. As part of the hackathon “What the Data!?” hosted by Cybus and Dezera, we built a basic system for monitoring energy flows in house.
Electricity is generated on campus using photovoltaics and thermal power stations. If the current consumption is higher than the generation that moment, the difference is covered by the building connection to the electricity grid. On the other hand, electricity can be stored in the public grid as soon as the current generation exceeds actual use. Our live visualisation shows the current relationship between supply and consumption.
The energy campus data is read out using Cybus middleware and provided from a MQTT broker. Reshin subscribes to the relevant topics of the broker, stores them for historical access and uses them for various visualizations.
